Light is fascinating. It travels at the maximum speed limit of our universe, at nearly 300 million meters per second in a vacuum. That’s about 7.5 times around the planet in one second! Think about that the next time you take a long-distance trip. So fast, in fact, that light experiences no time or distance. From light’s perspective traveling across the universe, it is emitted and then instantly absorbed. If that’s not mind-bending enough, light is understood to be a wave within the electromagnetic field, but behaves like a particle when measured.
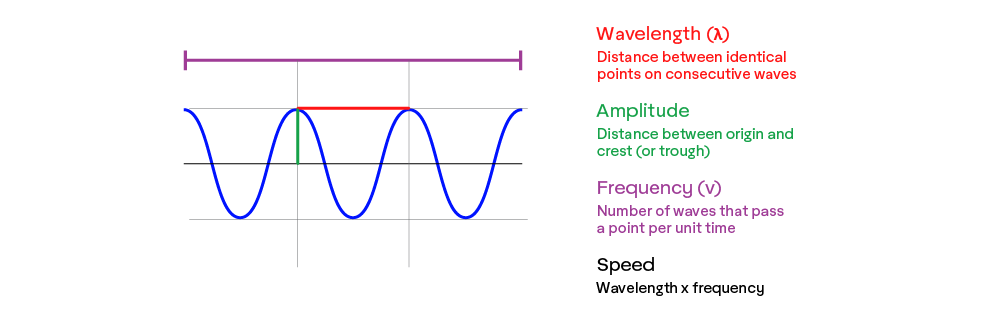
As a wave, the most important property of light is arguably its wavelength, which is determined by its energy. Wavelength (λ) (“lambda”) is the distance between each wave and is typically measured in some version of a meter. Because light always travels at basically the same speed, its wavelength is inversely correlated to its frequency (𝜈), which is the rate of waves that pass a point (usually per second).
What we call “light” is actually a spectrum that ranges from very high energy waves, such as gamma rays, x rays, and ultraviolet rays, to lower energy waves, such as infrared and radio waves. This spectrum, by definition, is a continuum, but for practicality, light waves are categorized into different regions depending on their interaction with matter.
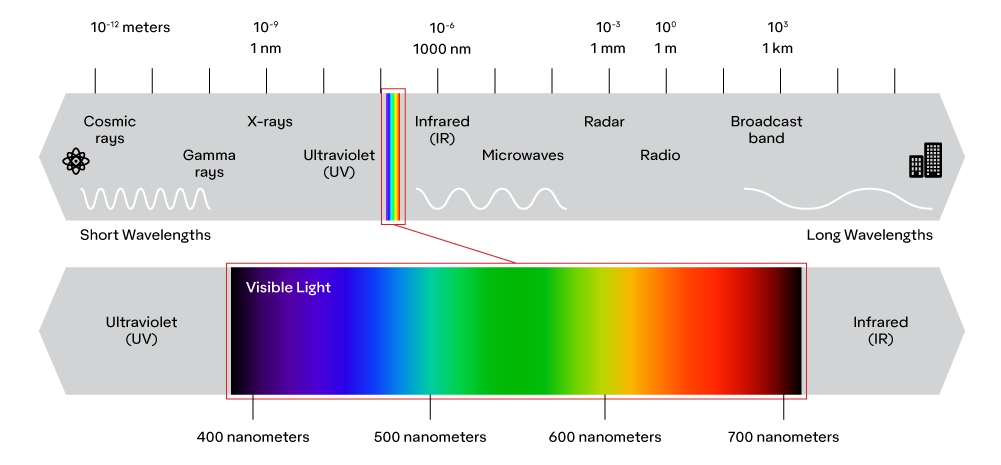
One of those regions is visible light, which is in between ultraviolet rays and infrared rays, from about 400 nm to 700 nm. Visible light, with wavelengths that are about the size of living cells, is simply the portion of the electromagnetic spectrum that interacts with the cells in our eyes (though some people can see slightly below 400 nm and some can see slightly above 700 nm.) Technically speaking though, there is nothing unique about visible light rays other than their wavelengths.
Visible light is further subdivided into regions called violet, blue, cyan, green, yellow, orange, and red based on how the wavelengths interact with normal human vision. The energy associated with these regions and how we perceive it is the source of color. In other words, to have color, a light source with the desired wavelengths is a prerequisite.
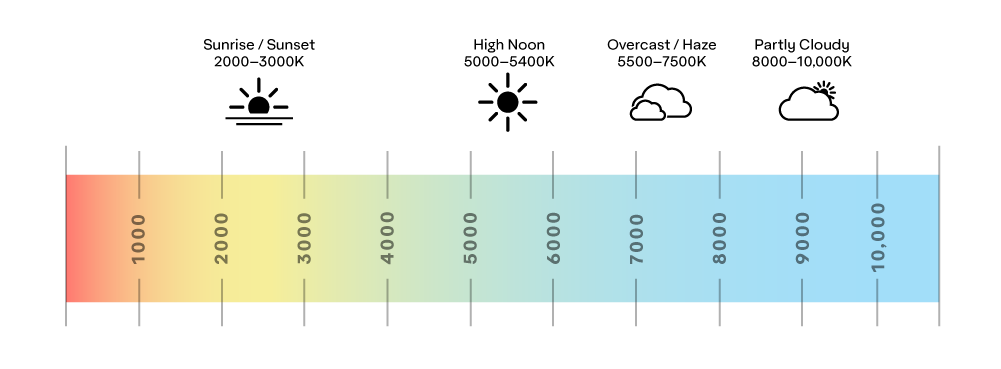
A common reference to a light source’s color is the Correlated Color Temperature (CCT), which can be found on commercially available light bulbs. CCT rates the bulb’s color as a temperature in degrees Kelvin (K). For example, a 2700K light bulb will appear yellow, while a 6500K bulb will appear blue.

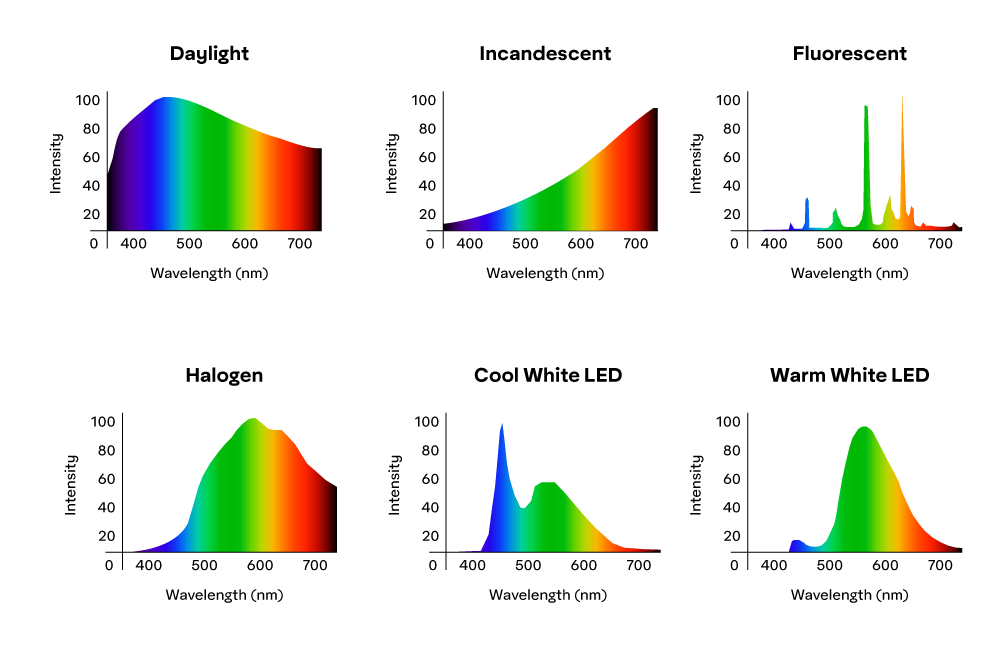
However, a more detailed way of evaluating which wavelengths are present in a light source is through its Spectral Power Distribution (SPD), which measures the relative intensity or concentration of each wavelength that the light source produces. In other words, it shows the available wavelengths and their intensity.
 Sunlight, for example, can have different SPD depending on the time of day, distance from equator, altitude, atmospheric conditions, and so on. Generally speaking though, midday sun has a fairly even power distribution when compared to other sources of light and is considered the best source of energy for most color applications.
As we will learn in later chapters, the SPD is an important factor when trying to quantify how light is absorbed and reflected by matter. It’s also an important factor to sign sheeting since different types of headlights produce varying colors. Looking at the SPD curves above, an object reflecting blue light could look different with the cool white LED illuminating it versus the fluorescent light for example.
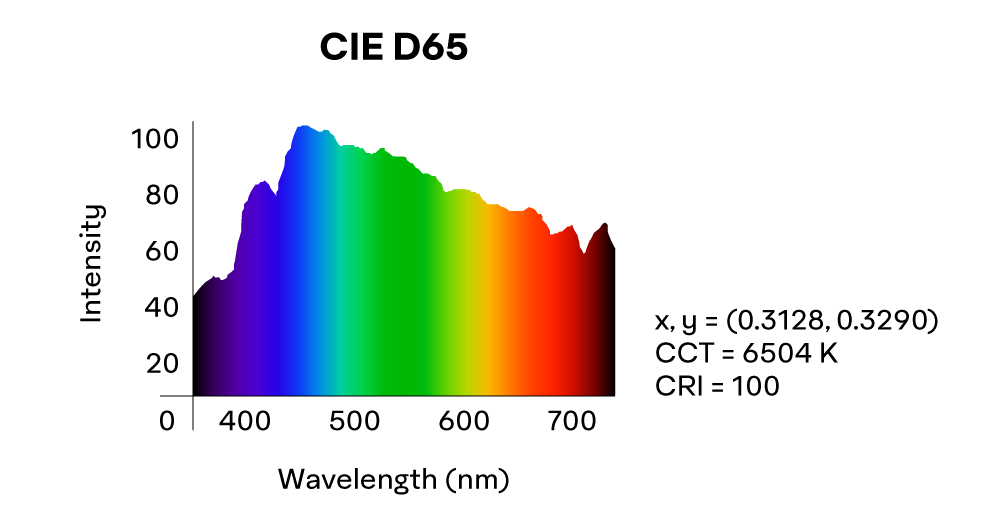
The Commission Internationale de l’éclairage (CIE) (International Commission of Illumination) is the leading international organization on light, illumination, and color and sets many of the standards referenced in photometry and colorimetry. To ensure color measurement consistency, most retroreflective sheeting standards reference CIE standard illuminant D65. Illuminants meeting this standard roughly correspond to the average midday sun, have a CCT of 6500K, and produce the following SPD: